

Analyze Feedback Form
Once your survey is launched and the responses are received, you need to analyze the results and generate reportsto have a detailed analysis which is made easier in Analyze Survey.We have numerous types of 2D/3D charts to generate sophisticated real time reports. You can use Analyze survey's advanced analytical tools like filters, cross tabs, individual responses and so on, to display only the responses you are interested in and in the format you want. You can export your reports, with 3D charts and graphs in the form of word documents or excel sheets.Filters
Filters enable you to look for specific data or patterns in your data. Whenever you have queries to look at a subset of your overall data, you can filter it. When you create a new filter, you can name and save that filter. The newly created filter can then be applied to the survey data, whenever needed.Create New Filter
- Click
 in the analyze page, you are diverted to the following screen,
 - Give a filter name in the text box provided
- Click Submit, the ‘Edit Filter’ page is displayed
- If you want the response data for a particular period, give start date and end date in the text box provided
- If you want the response data of particular people, search by name or by e-mail address
- If you want the response data of particular question, select the question from the dropdown list, and select a prospective answer to be filtered, click Add. You can see the preview of the selected question and answer and if you want to delete it you can do so.
- You can also combine all the three option and apply a filter
- Once you have finished setting the filter, click Save and Continue
Apply Filters
- Select the filter from the dropdown list
- Click Selected filter is applied and a report is generated
Edit Filters
- Select a filter from the dropdown list
- Click
 ‘Edit Filters’ page is displayed
 - Edit the necessary fields
- Click Save and Continue
Remove Filters
- Select the filter that is to be removed
- Click
 The filter is removed and a normal report is generated
Reports
Analyze Survey offers different types of reports and charts to help you analyze the survey results in a better way.
Frequency Report
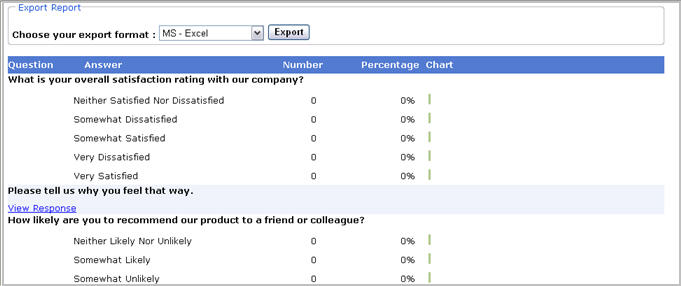
Here you can see an overview of the total response for each question. You can choose a format and export it. · Click ‘Frequency Report’
Frequency Custom Chart
In Frequency custom chart, you have an option to choose from various 2D/3D charts. Your report will be displayed in the chosen form.The available chart formats are viewed at the left end of the screen,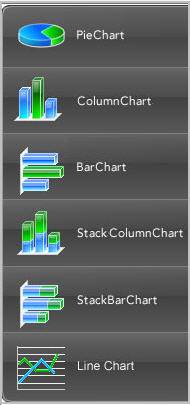
- Choose a chart type
- Select the custom chart properties. The custom chart properties in the 'Other settings'
in the right side screen
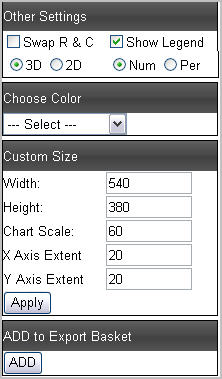
- Click 'Generate', Now the report is viewed in that specific format
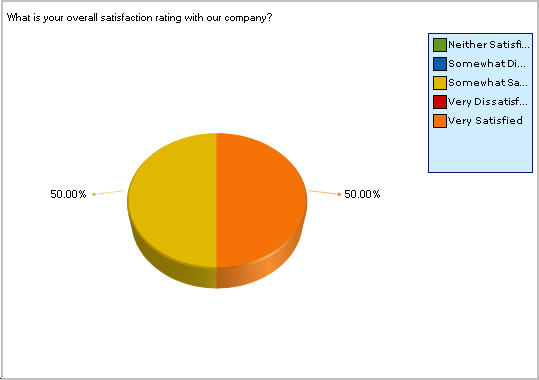
Cross Tab Report
In cross tab report, you can select a question and its answers. The report will be based on these answers
- Click ‘Cross Tab Report’
- Choose a question
- Choose an answer’
- Click 'Generate' to view the report
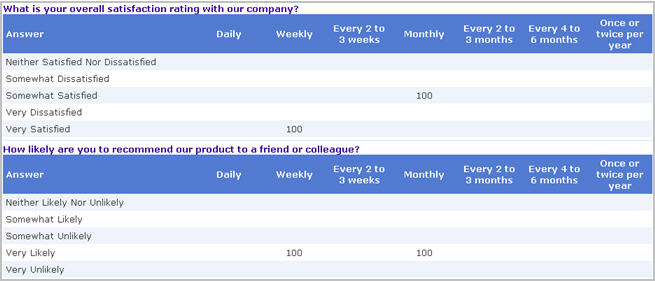
You can also generate customized cross tab reports in different formats like pie charts,column chart and so on in the 'Cross Tab Custom Chart' menu.
Individual Responses
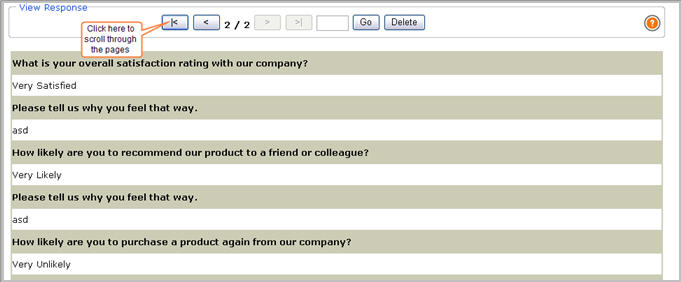
In individual responses, you can individually view each and every response received.- When results are viewed through 'Individual Response' the responses are displayed one by one
- Click to view previous responses
- Click to view last response
- Click to view first response
- Write the response number in the text box provided click Go, to go to that particular response
Raw Data
Here the data is presented in an unprocessed form just as it is stored in the database. It can be exported from here in excel sheets and further analysis can be done with it.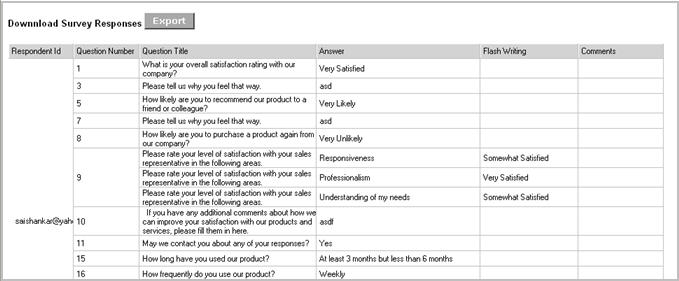
Click Export to download the survey response.
Export Reports and Charts
Analyze Survey provides you with the facility to export your reports and charts in MS Word , Excel and PDF formats. Each tab under ‘Analyze’ has an option to export your results.- Click any tab, the report under which you want to export
- Select the export format
- Click Submit
Advanced Settings
Frequently Asked Questions
1. What are filters?Filters enable you to look for specific data or patterns in your data. Whenever you have queries to look at a subset of your overall data, you can filter it. When you create a new filter, you can name and save that filter. The newly created filter can then be applied to the survey data, whenever needed. Only those responses that meet your filter criteria will be viewed when it is applied.
Can I edit the existing filters?
2.Yes, you can edit the existing filters.
2. Select a filter from the dropdown list
3. Click ‘Edit Filters’ page is displayed
4. Edit the necessary fields
5. Click Save and Continue
3. How can I create my own charts and graphs?
Analyze Survey provides options where you can create numerous types of 2D/3D charts.
Click ‘Frequency Custom chart’,
The chart types are displayed
Select the type of chart you want
Set ‘Custom Chart Properties’
Click Generate
4. How can I view my feedback form in data format?
You can view your feedback form in data format through the frequency report option,
5. Can I cross tabulate my feedback form results and view it in the form of charts?
Analyze Survey allows you to cross tabulate your results based on a single option in a question.
Click ‘Cross Tab Report’
Choose a question
Choose an answer
Click Generate
7. How do I download/export my feedback form results and charts?
Analyze Survey provides you with the facility to export your reports and charts in MS Word and Excel formats. Each tab under ‘Analyze’ has an option to export your results. 2. Click the tab of the report format of your choice you want to export
Select the export format
Click Submit
8. Can I view the response of each individual?
Yes, you can view individual responses navigating through the‘Individual Responses’ tab
9. Can I enlarge the view of the report generated?
Yes, you can enlarge the view of the report generated by clicking on